

Someone in your company has asked for a customer loyalty number, and the usual answer is Net Promoter Score. It is simple to collect and easy to explain in a meeting, which is why it shows up in board decks and quarterly reviews. It is also easy to misread. This guide covers what the score measures, how to calculate it, what a good result looks like, how to run a customer NPS survey, and how to analyze the answers, including the free-text comments that explain them.
Fred Reichheld of Bain & Company introduced the metric in 2003, and it has become one of the most widely used loyalty measures in customer research.
Key takeaways
- Net Promoter Score (NPS) is the percentage of promoters (9 or 10) minus the percentage of detractors (0 to 6), a whole number from −100 to +100.
- Passives, who answer 7 or 8, stay in the total but never enter the subtraction, so a large passive group dilutes the score.
- Scores above 30 are informally called good and above 50 excellent, but your own trend, measured the same way each wave, is the stronger benchmark.
- With 400 responses the 95% margin of error on NPS is roughly 8 points, so a small move between waves can be noise.
- The comment explaining each score holds most of the insight, and coding those comments into themes shows what to fix first.
What is the NPS scale, and who counts as a promoter, passive or detractor?
The Net Promoter Score survey asks a single question: “How likely are you to recommend our company, product or service to a friend or colleague?” Respondents answer on an 11-point scale from 0 (“not at all likely”) to 10 (“extremely likely”). That 0 to 10 range is the NPS scale, and the answers fall into three groups.
| Group | Scores | What it signals |
|---|---|---|
| Promoters | 9 or 10 | Enthusiastic customers who are likely to recommend you |
| Passives | 7 or 8 | Satisfied but not committed; open to a competitor’s offer |
| Detractors | 0 to 6 | Unhappy or indifferent customers, less likely to recommend you |
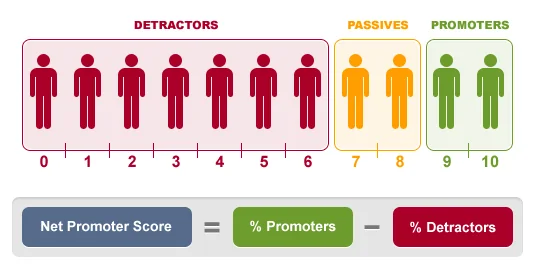
The cut-offs are not arbitrary, but they are a convention. A customer who gives you a 6 may be mildly positive, yet the method treats that answer as a detractor. That is a deliberate choice to separate real enthusiasm from polite agreement, and it is the reason NPS tends to read lower than average satisfaction scores.
Passives deserve a closer look than they usually get. They count in the base of respondents, so they dilute the score, but they do not add to it or subtract from it. A large passive group usually means customers who are content and have no strong reason to stay, which is a different problem from having many unhappy ones.
How do you calculate NPS?
The calculation is a subtraction. Take the percentage of respondents who are promoters and subtract the percentage who are detractors. Passives are left out of the subtraction.
NPS = % promoters − % detractors
The result is a whole number from −100 to +100. It is not a percentage, so you report it as “NPS of 19”, not “19%”. The steps:
- Collect responses to the 0 to 10 recommendation question.
- Count the respondents in each group: 9 or 10, 7 or 8, and 0 to 6.
- Divide each count by the total number of respondents to get percentages.
- Subtract the detractor percentage from the promoter percentage.
- Report the score together with the base (number of respondents) and the field dates.
Worked example
Suppose you survey 400 customers and get these results.
| Group | Respondents | Share of 400 |
|---|---|---|
| Promoters (9 or 10) | 168 | 42% |
| Passives (7 or 8) | 140 | 35% |
| Detractors (0 to 6) | 92 | 23% |
The arithmetic is 42% − 23% = 19, so the NPS is +19. The 140 passives never appear in the formula, but they are part of the 400 that every percentage is based on.
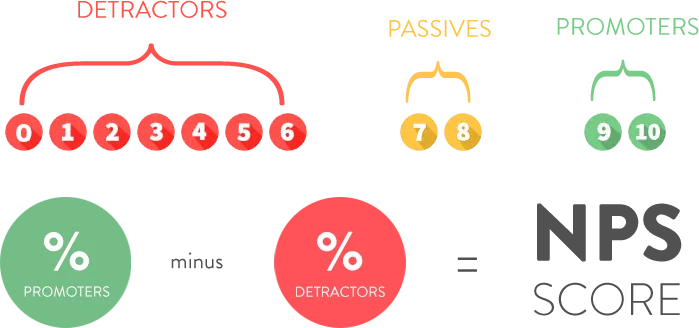
Two companies can have the same score and very different customers. If one has 40% promoters, 20% passives and 40% detractors, and the other has 10% promoters, 80% passives and 10% detractors, both score 0. The first is polarized, the second is lukewarm, and they need different responses. For a longer walkthrough with more examples, see our step-by-step guide on how to calculate Net Promoter Score.
What is a good Net Promoter Score?
Any score above zero means you have more promoters than detractors. Beyond that, “good” depends on your category, your customers and how the survey was run.
A common informal rule of thumb treats scores above 30 as good and above 50 as excellent. Treat those numbers as a rough guide only. Categories differ, and so do survey methods. A score collected right after a positive interaction usually runs higher than one collected from a random sample of all customers.
The comparison that holds up is like for like:
- Your own score over time, measured with the same question, audience and method each wave.
- Competitors or peers, only when the same question was asked of a comparable sample.
- Segments within your base, such as new versus long-tenured customers, or one product line versus another.
A benchmark copied from an article that does not describe its sample is a weak target. A trend in your own data is a strong one.
How do you run a customer NPS survey?
A customer NPS survey is short by design, but a few choices determine whether the number means anything.
Choose a relationship or a transactional survey
A relationship survey goes to customers on a schedule, regardless of what they did recently, and measures overall loyalty. A transactional survey is triggered by an event, such as a delivery or a support case, and measures how that event affected the likelihood to recommend. Do not mix the two in one score. They answer different questions and run at different levels.
Ask the question and one follow-up
Use the standard wording so your score is comparable over time. Follow it with an open-ended question such as “What is the main reason for your score?” That single comment box is where most of the insight comes from, as the section on analyzing comments below explains.
Sample carefully and be consistent
Decide who is eligible, how they are invited and when. If your survey only reaches customers who log in weekly, your NPS describes active users, not all customers. Keep the audience, channel and timing stable between waves so that a change in the score reflects a change in customers rather than a change in method.
Avoid offering incentives tied to the score, and do not let account managers coach customers on how to answer. Both inflate the result and make the trend unreliable.
How do you analyze NPS survey results?
The headline score rarely explains itself. A score of +19 tells you where you stand, not why, and not what to do. Three cuts do most of the work in NPS survey analysis.
Cut by segment
A flat overall score often hides a decline in one group offset by a gain in another. Break the result down by tenure, product, region, customer size and channel before drawing conclusions. If detractors are concentrated in customers who joined in the last 90 days, you have an onboarding problem, not a product problem.
Track the distribution over time
Report the share of promoters, passives and detractors alongside the score. A rise from +12 to +19 driven by fewer detractors calls for a different response than the same rise driven by more promoters. The first means you fixed something; the second means you earned something.
Test whether a change is real
NPS is the difference of two proportions taken from the same sample, so its margin of error is wider than people expect. In the 400-response example above, the 95% margin of error on a score of +19 is roughly 8 points, so the true value could plausibly sit anywhere from the low teens to the high twenties. A move from +19 to +23 between waves would not be distinguishable from noise at that sample size.
If you compare two waves or two segments, run a significance test rather than comparing the numbers by eye. Our explainer on visualizing survey data for Net Promoter Score analysis shows chart choices that keep the base size and uncertainty visible.
Pair the score with drivers
If your survey also asks customers to rate attributes such as price, support, ease of use and reliability, you can see which ones move with likelihood to recommend. Those with the strongest relationship are the places where an improvement is most likely to change the score. If you want to see what drives satisfaction and loyalty by segment, this is the analysis to start from. A correlation is not proof of cause, so confirm the leading drivers against what customers say in their own words.
How do you analyze open-ended NPS comments?
The “why did you give that score” comment is usually the most valuable data in the survey and the least analyzed. A score tells you how many customers are unhappy. The comments tell you what to fix. Analyzing them is a coding exercise: turning free text into themes you can count.
- Read a sample first. Read 50 to 100 comments, spread across promoters, passives and detractors, before building anything. You are looking for the topics customers raise on their own.
- Build a coding frame. Write a short list of themes, such as “onboarding”, “pricing”, “support response time” and “reliability”. Define each in a sentence so that two coders would tag the same comment the same way. Add an “other” theme and review it, because new topics hide there.
- Code every comment. Tag each response with one or more themes. For large volumes, text analytics can apply the frame automatically, but check a random sample of its tags against your own reading.
- Cross themes with the score group. Count how often each theme appears among promoters, passives and detractors. A theme that is common among detractors and rare among promoters is a likely cause of dissatisfaction.
- Rank by impact and fixability. The most frequent complaint is not always the one to act on first. Weigh how many detractors mention it against how realistic a fix is.
- Keep the verbatims. Attach two or three representative quotes to every theme. A number gets a decision made; a customer’s own words get it taken seriously.
For example, imagine that of 92 detractors in a survey, 31 mention slow support responses and 12 mention price. That is 34% and 13% of detractors (the numbers here are illustrative). Support response time is the larger lever, and reading the verbatims will tell you whether the complaint is about speed, tone or missing follow-up.
Promoter comments matter too. They tell you what to protect when you change something, and which strengths customers describe in their own language, which is useful when writing about your product.
Automated theme detection is useful for volume, but a theme is only worth reporting if a team can act on it. “Customer experience” is not a finding. “Customers wait more than a day for a reply to a billing question” is.
How do you do this in practice?
You can run NPS analysis in a spreadsheet for a single survey, but it gets slow once you track several waves and cut by many segments. Halo Reports is built for this kind of work: crosstabs and banner tables with weighting and significance testing, charts, and interactive report pages, including Net Promoter Score views, so you can see the score by segment and share the result with colleagues.
What are the common mistakes with NPS?
- Reporting the score without the base. An NPS of +19 from 40 respondents and one from 4,000 are not equally reliable. Show the number of responses and a margin of error on every chart.
- Comparing against someone else’s benchmark. Different questions, audiences and timing produce different scores. Compare against your own history first.
- Changing the method between waves. Altering the invite email, the channel or the audience shifts the score for reasons that have nothing to do with loyalty.
- Treating the score as the goal. When teams are rewarded for the number, they start managing the survey instead of the customer experience. Treat NPS as a measurement and use the comments to decide what to do.
- Ignoring passives. They are often the largest group. Understanding what would move a passive to a 9 is usually cheaper than recovering a detractor.
- Using NPS for everything. It measures likelihood to recommend, not satisfaction with a specific feature or a purchase. Pair it with questions about the things you want to improve.
What should you do next?
Start with what you already have. If you have survey data, calculate the score and the three-way split, then cut it by your two or three most important segments. Read 50 detractor comments and write down the themes you see.
If you are starting a program from scratch, fix the question wording, the audience and the schedule first, and keep them stable for at least four waves so the trend means something. Once you are tracking waves, a ranked view of what changed across your trackers shows which movements are worth a closer look.