What is Analysis of Variance (ANOVA)?
Analysis of variance (ANOVA) is a statistical method that is used to compare the means of multiple groups.
Analysis of variance (ANOVA) is a statistical method that is used to compare the means of multiple groups.
Analysis of variance (ANOVA) is a statistical technique used to determine if there is a significant difference between the means of three or more groups. It is commonly used in social and natural sciences to compare the means of different populations or treatments.
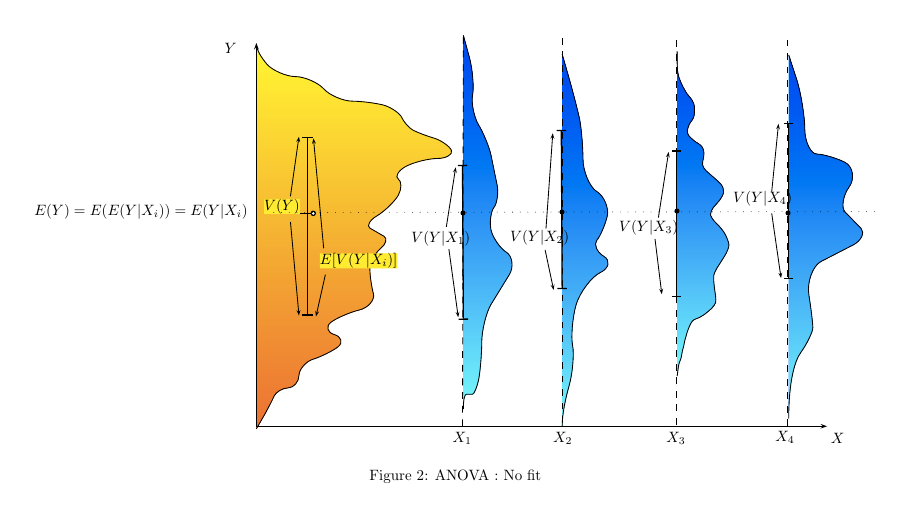
ANOVA is based on the idea that if the means of two or more groups are different, then the variance of the data in each group should also be different.
ANOVA involves the following steps:
The ANOVA results will show you the following information:
The F-statistic is a measure of how likely it is that the null hypothesis is true. The null hypothesis is the hypothesis that the means of the groups are equal. The p-value is the probability of getting an F-statistic that is at least as large as the one you observed, assuming that the null hypothesis is true.
If the p-value is less than your chosen significance level, then you can reject the null hypothesis and conclude that the means of the groups are not equal.
Here are a few tips for conducting an ANOVA:
ANOVA is a statistical technique used to compare the means of three or more groups. It involves formulating the null hypothesis, collecting data, calculating the sum of squares between groups and within groups, determining the degrees of freedom, and calculating the F-statistic and p-value. The results of ANOVA can be interpreted based on the p-value, which determines whether the null hypothesis can be rejected or not. ANOVA is a powerful tool for comparing means in social and natural sciences, and its results can provide valuable insights for decision-making.
To perform survey data analysis be sure to try mTab for your data analysis needs.

Make smarter decisions faster with the world's #1 Insight Management System.


