What is a correlation matrix?
A correlation matrix is a table that shows the correlation coefficients between a set of variables.
A correlation matrix is a table that shows the correlation coefficients between a set of variables.
A correlation matrix is a table that shows the correlation coefficients between a set of variables. The correlation coefficient is a measure of how closely two variables are related. A correlation matrix can be used to identify patterns and trends in data, and to understand the relationships between variables.
In this blog post, we will discuss what a correlation matrix is, how to create one, and how to interpret the results. We will also provide some tips on how to use correlation matrices in your research.
A correlation matrix is a table that shows the correlation coefficients between a set of variables. The correlation coefficient is a measure of how closely two variables are related. A correlation matrix can be used to identify patterns and trends in data, and to understand the relationships between variables.
The correlation coefficient is calculated by dividing the covariance of two variables by the product of their standard deviations. The covariance is a measure of how much two variables vary together. The standard deviation is a measure of how much a variable varies from its mean.
The correlation coefficient can range from -1 to +1. A correlation coefficient of 0 indicates that there is no correlation between the variables. A correlation coefficient of +1 indicates a positive correlation, meaning that as one variable increases, the other variable also increases. A correlation coefficient of -1 indicates a negative correlation, meaning that as one variable increases, the other variable decreases.
To create a correlation matrix, you will need to have a data set that contains at least two variables. Once you have your data set, you can follow these steps:
Once you have created a correlation matrix, you can interpret the results to understand the relationships between your variables. Here are a few tips:
The values in a correlation matrix range from -1 to +1. A value of -1 indicates a perfect negative correlation between two variables, which means that as one variable increases, the other variable decreases. A value of +1 indicates a perfect positive correlation, which means that as one variable increases, the other variable also increases. A value of 0 indicates no correlation between two variables, which means that there is no relationship between the two variables.

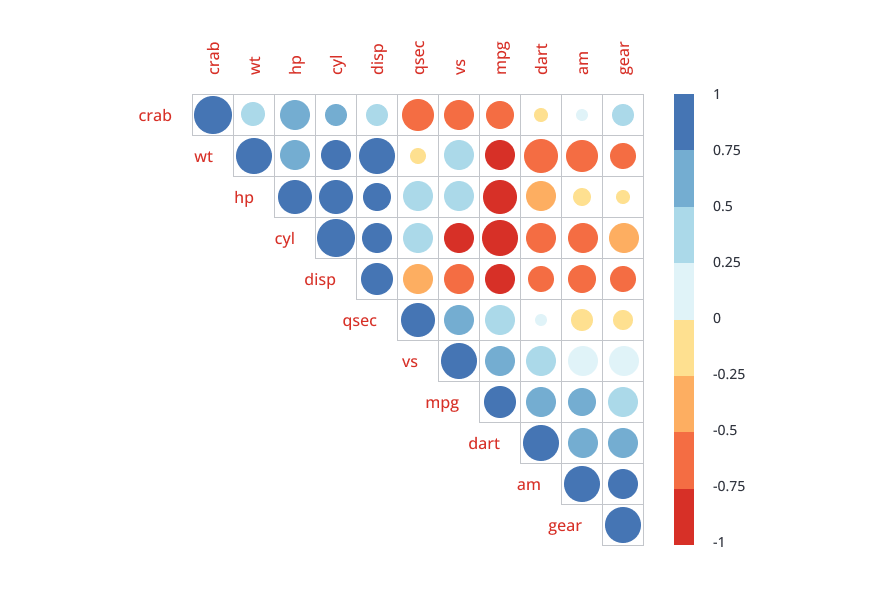
Correlation matrices can be created using statistical software, such as R or Python, and are often visualized using heatmaps or other graphical representations. By examining a correlation matrix, analysts can identify variables that are strongly related to one another and can use this information to better understand the underlying patterns and relationships in their data.
Correlation matrices can be used in a variety of research applications. Here are a few examples:
Correlation matrices are a powerful tool that can help you understand your data and make better decisions. By understanding how correlation matrices work and how to use them, you can get the most out of your research.
There are 5 different types of correlation matrix, including:
1. Pearson Correlation Matrix: This is the most commonly used type of correlation matrix, and it measures the linear relationship between variables. The Pearson correlation coefficient ranges from -1 (perfect negative correlation) to +1 (perfect positive correlation), with 0 indicating no correlation.
2. Spearman Rank Correlation Matrix: This correlation matrix is used to measure the strength and direction of the monotonic relationship between variables, meaning the relationship that exists when one variable increases or decreases with the other variable. The Spearman correlation coefficient ranges from -1 to +1, with 0 indicating no correlation.
3. Kendall's Tau Correlation Matrix: This correlation matrix is similar to Spearman's correlation matrix and is used to measure the strength and direction of the monotonic relationship between variables. The Kendall correlation coefficient ranges from -1 to +1, with 0 indicating no correlation.
4. Point-Biserial Correlation Matrix: This correlation matrix is used when one variable is dichotomous (binary) and the other variable is continuous. It measures the correlation between the dichotomous variable and the continuous variable. The point-biserial correlation coefficient ranges from -1 to +1, with 0 indicating no correlation.
5. Biserial Correlation Matrix: This correlation matrix is used when both variables are continuous, but one variable is artificially dichotomized. It measures the correlation between the dichotomized variable and the continuous variable. The biserial correlation coefficient ranges from -1 to +1, with 0 indicating no correlation.
These are some of the most common types of correlation matrix used in statistical analysis. The choice of correlation matrix depends on the nature of the data and the research question being addressed.
Try performing an analysis of your survey data with mTab.

Make smarter decisions faster with the world's #1 Insight Management System.


